
SKU Upload Analyzer
Upload your inventory export and see where the storage and slotting opportunities actually are — ABC classification, the size of your slow-moving tail, cube profile, and which storage systems are worth evaluating. Your full analysis appears on screen before we ask you for anything.
Your WMS already knows where your storage problem is
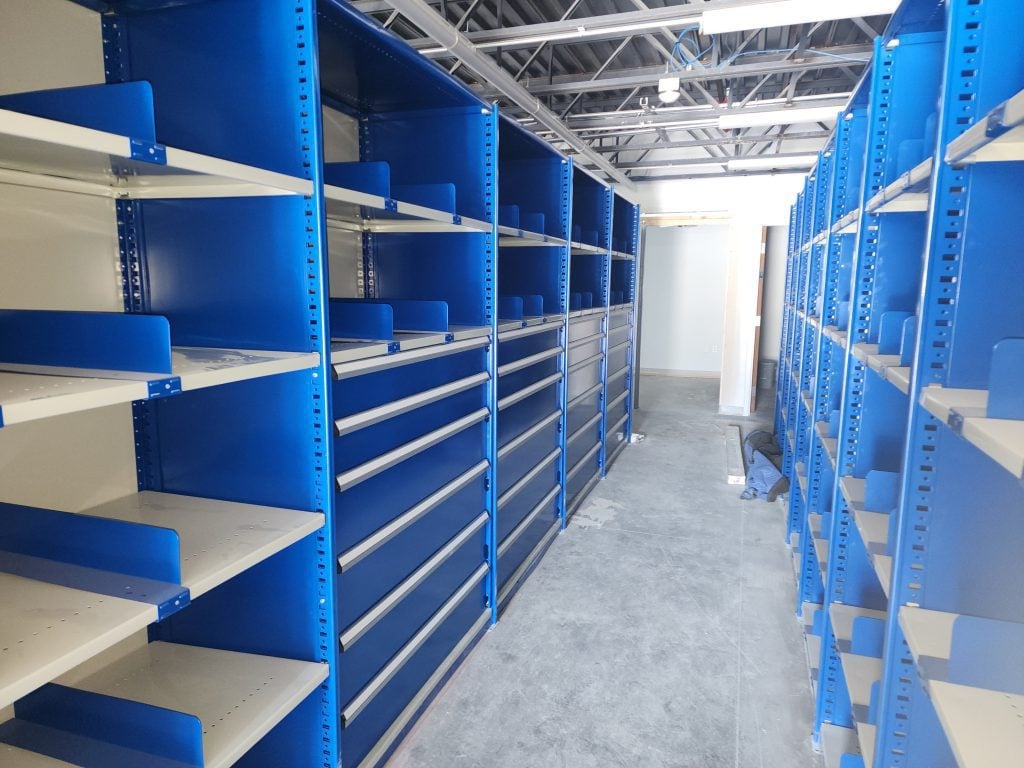
Nearly every operation we walk into has the answer to its own storage problem sitting in a spreadsheet. The item master knows how many SKUs there are. The pick history knows which ones move. Somewhere there are carton dimensions. What almost nobody has is the ten minutes to put those three things together and ask the obvious question: are the SKUs we touch every hour stored where they should be, and is the tail eating shelving it does not deserve?
That question matters because the two most expensive mistakes in a stockroom are invisible on a walk-through. The first is travel — pickers walking past hundreds of slow SKUs to reach the fast ones. The second is density — giving a full shelf bay to items that would fit in a drawer or a pouch, then paying for a building big enough to hold all those bays.
This tool does that analysis for you from a plain export. It classifies your SKUs by real recorded activity, shows how concentrated that activity is, profiles the cube of your items, and tells you honestly which of those findings your data was good enough to support.
Who this is for
- Warehouse, stockroom and distribution managers who suspect their slotting is wrong but need evidence
- Operations leaders comparing higher-density storage against leasing more space
- Parts and MRO managers whose catalog has grown faster than the shelving
- 3PLs and fulfilment operations preparing for a layout or storage change
What you need to hand
- A CSV or tab-separated export with one row per SKU — any column order
- A SKU or item-number column (the only thing that is genuinely required)
- Picks, order lines, annual usage or velocity, if you have it — this is what unlocks ABC classification
- Carton length, width and height, even approximate — this unlocks the cube and density analysis
- Quantity on hand, weight and bin location if they are in the export
Don’t have all of it? Every field that can be left blank, can be — the tool tells you which missing number would change the answer most.
Run the analysis on your own data
Your complete analysis — the ABC table, the findings, the storage candidates and the data-quality notes — appears on this page as soon as it finishes. We only ask for your details if you want it emailed, reviewed by one of our people, or priced.
Prefer a full window? Open the sku analyzer in a new tab.
How it works
Export your inventory
Any item-level export from your WMS, ERP or a spreadsheet. Save it as CSV. Column names do not need to match anything — the tool maps them and tells you exactly which columns it used and which it ignored.
Upload it
The file is read in your browser and analysed immediately. It is treated as confidential, is never published, and is used only to prepare your analysis and any review you ask for.
Read the analysis
ABC classification with the share of activity in each class, cube profile, dead-stock share, the storage systems your profile points to, and a plain list of what was missing from the data.
Decide what to do with it
Print it, have it emailed to you, or ask us to review it. A review is a conversation about which of these opportunities is worth doing first — usually the free one, not the capital one.
How to read your results
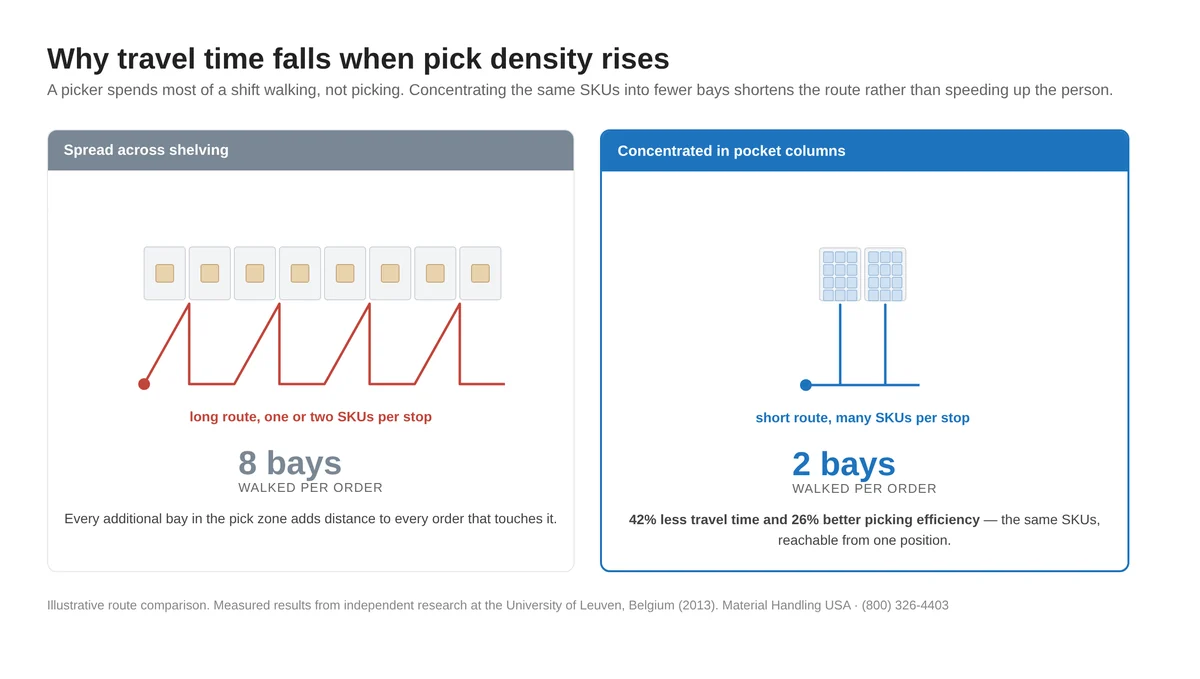
Class A is the first 80% of recorded activity. In most catalogs that is a small fraction of the SKUs, and it is the group that should sit in the golden zone — between knee and shoulder height, on the shortest travel path, closest to packing. If your Class A share of SKUs is small and your findings mention a large slow tail, re-slotting alone usually pays for itself before any equipment is bought.
Class C is the tail: the SKUs that must be stocked but are rarely touched. A large C class is the clearest signal for high-density storage — modular drawers, bin shelving, or vertical pouch storage — because it means shelf space is being spent on items that will not be picked this month.
Cube profile tells you whether your catalog is physically suited to density at all. A catalog dominated by items under a cubic foot typically stores several times more densely in drawers or pouches than on standard shelving. A catalog of bulky items usually needs a rack conversation instead.
Data quality notes matter as much as the numbers. The tool lists every column it ignored and every analysis it skipped for lack of data. If it says ABC was skipped because no activity column was found, the fix is one extra column in your export — not a different tool.
What this tool does not do
This is a planning analysis of the data you upload. It is not a warehouse design, an engineered storage specification, or a quote.
- Results depend entirely on the accuracy of your export — a single-period pull can badly misrepresent seasonal SKUs.
- Storage-system candidates are directions to evaluate, not sized, engineered or priced systems.
- No capacity, load, seismic or safety conclusion should be drawn from this analysis.
- The tool does not model your building, aisle layout, equipment or labour rules — those come into a real design review.
Related storage systems and tools
Warehouse Automation ROI Business Case
Put a dollar figure on the travel and errors this analysis points to, with editable assumptions.
Storeganizer high-density storage
Vertical pouch storage — usually the strongest answer to a large small-parts C class.
Modular drawers and bin cabinets
Where a small-item catalog belongs when shelving is being wasted on it.
Bin shelving systems
The workhorse for medium-velocity small parts and golden-zone re-slotting.
Vertical lift modules
Goods-to-person storage for a highly concentrated activity band.
Pallet rack systems
For the bulky end of the catalog the analysis flags.
Common questions
Do I have to give you my email to see the results?
What if my export does not have pick or usage data?
How is ABC calculated here?
Is my inventory file confidential?
What file formats work?
What happens if I ask for a review?
Want someone to pressure-test the numbers?
Send us the analysis and we will tell you which opportunity is real, which one is noise, and what it would take to act on the one that matters.